There is no single average tennis serve speed that describes every level, age and measurement system. Stakhovsky Tennis separates a historical Grand Slam study, where first serves averaged 184.1 km/h for men and 158.5 km/h for women, from the ATP Tour's 2025 leader, Giovanni Mpetshi Perricard, at 134.4 mph (216.3 km/h). These are different populations and periods, not targets every player should reach.
- Average
- A mean over the source's defined observations, not a player's fastest attempt.
- Maximum
- One recorded peak, tied to an event and measurement system.
- Coaching estimate
- A published rule of thumb without a disclosed measured sample.
- Unit conversion
- 1 mph = 1.609344 km/h. Converted speeds are rounded to one decimal.
What is a good serve speed at each level?
A useful benchmark matches the player, the serve type and the device. A fast fault does not help a service game, and a peak-speed test is not a match average. Record accuracy and placement alongside pace.
The following are PlayYourCourt's July 2026 coaching estimates, not measured population averages or official level cutoffs. Its article does not disclose a sampling method. We retain its three recreational table ranges as attributed guidance, not as a validated rating scale.
| Source's player label | mph | km/h, converted | Evidence |
|---|---|---|---|
| Beginner | 50–70 | 80.5–112.7 | Coaching estimate |
| Solid club player | 80–100 | 128.7–160.9 | Coaching estimate |
| Advanced recreational | 100–115 | 160.9–185.1 | Coaching estimate |
Do not use these ranges to assign NTRP, UTR or World Tennis Number. The tennis levels guide explains what those systems actually measure.
Can serve speed identify an NTRP level?
No. A serve-speed reading alone cannot establish a player's competitive level. App-derived speeds also depend on the product's measurement definition, camera setup and treatment of first serves, second serves and faults. A table without those details cannot establish a national average for a 3.5 or 4.0 player.
This compilation does not publish an NTRP-to-speed conversion. For rating evidence, use the sourced UTR and NTRP comparison. For personal progress, compare repeated tests using the same equipment and protocol.
Average men's and women's professional serve speeds
Rod Cross's 2014 ITF paper reports the historical means below. Men's observations came from the 2008 US Open and 2009 Australian Open, French Open and Wimbledon. Women's observations used the 2008 US Open and Wimbledon, plus the 2009 Australian and French Opens.
| Population and measure | km/h | mph, converted | Period |
|---|---|---|---|
| Men, first serve | 184.1 | 114.4 | 2008–2009 |
| Women, first serve | 158.5 | 98.5 | 2008–2009 |
| Men, second serve | 150.4 | 93.5 | 2008–2009 |
| Women, second serve | 133.4 | 82.9 | 2008–2009 |
| Men, mean maximum of 20 fastest servers per event | 218.6 | 135.8 | 2013 |
| Women, mean maximum of 20 fastest servers per event | 185.6 | 115.3 | 2013 |
The extraction covered available speed data across men's full draws and women's round-three-to-final matches. Repeated appearances by advancing players enter the averages, and not every court recorded speeds. These are not current ATP/WTA tour-wide means or independent samples of 127 men and 31 women.
Calculated from those historical means, second serves were 33.7 km/h slower for men and 25.1 km/h slower for women. Neither gap is a recommended percentage reduction for your own second serve.
Who had the fastest average serve in 2025?
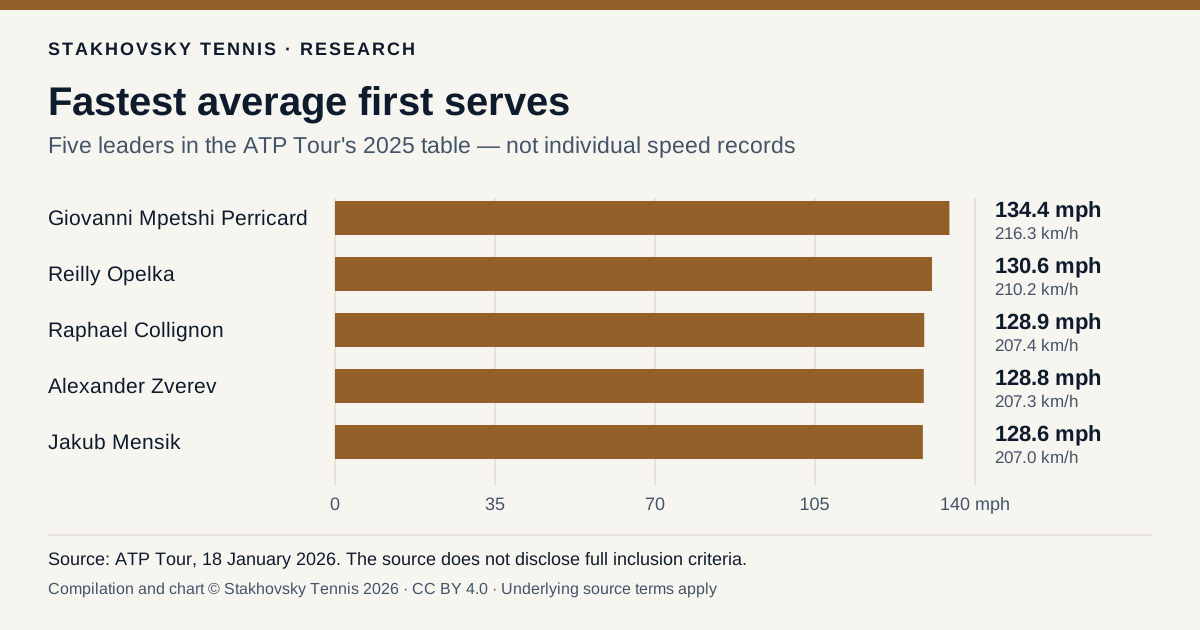
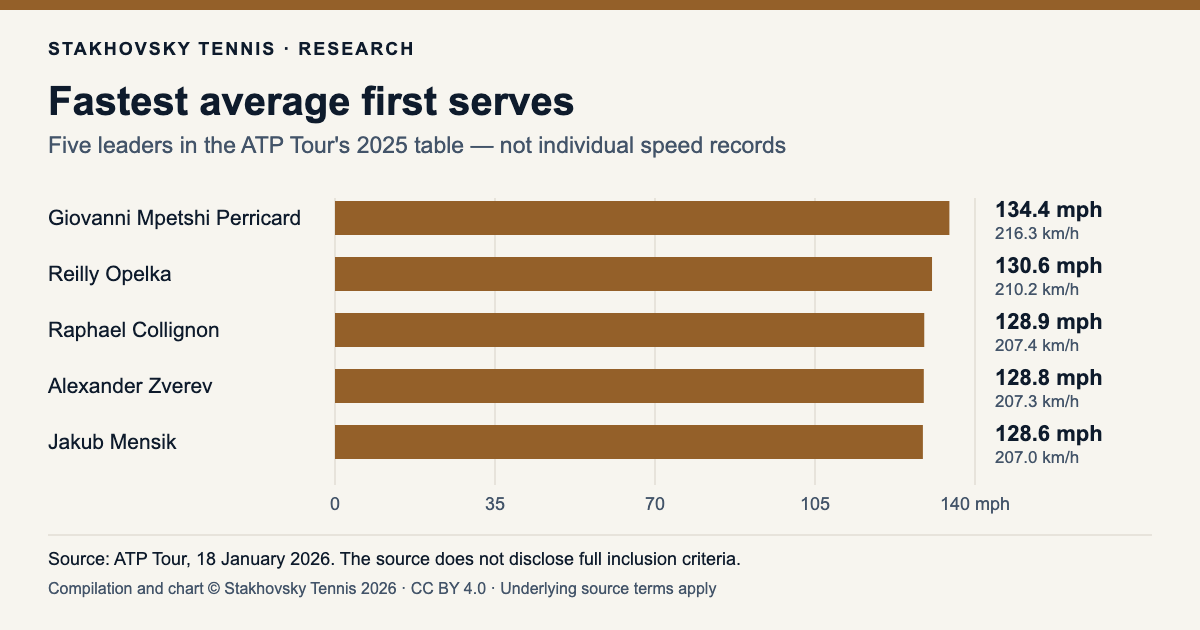
The ATP Tour's report published 18 January 2026 lists Giovanni Mpetshi Perricard first for both first- and second-serve average speed in 2025. The tables retain that season. They do not claim to rank the unfinished 2026 season.
| Player | mph, source | km/h, converted |
|---|---|---|
| Giovanni Mpetshi Perricard | 134.4 | 216.3 |
| Reilly Opelka | 130.6 | 210.2 |
| Raphael Collignon | 128.9 | 207.4 |
| Alexander Zverev | 128.8 | 207.3 |
| Jakub Mensik | 128.6 | 207.0 |
| Player | mph, source | km/h, converted |
|---|---|---|
| Giovanni Mpetshi Perricard | 117.0 | 188.3 |
| Valentin Vacherot | 112.5 | 181.1 |
| Reilly Opelka | 110.2 | 177.3 |
| Gabriel Diallo | 108.9 | 175.3 |
| Ben Shelton | 107.8 | 173.5 |
The article supplies selected leaders, not a downloadable all-player sample with inclusion criteria. Speed alone does not rank serve effectiveness.
Junior serve speed by age and gender
Parpa and colleagues' study in Sports, volume 11 (2023), published online on 28 December 2022, tested 27 youth players. It is a small study, not an age-by-age international norm.
| Group | Players | Mean age | km/h, raw source | mph, converted |
|---|---|---|---|---|
| Boys | 16 | 15.69 years | 174.69 | 108.5 |
| Girls | 11 | 15.82 years | 146.45 | 91.0 |
Height was associated with serve velocity in the boys' sample (r = 0.60). Association is not proof that changing one physical measure causes a faster serve. Maturation, skill and the testing method matter; these figures are not pass/fail standards for a 15-year-old.
A junior's development plan should connect the serve to competition demands. See the European junior pathway and college tennis preparation for the wider decision.
Fastest recorded serves: selected verified observations
Record lists depend on event coverage, radar calibration and recognition policy. This is a selected evidence register, not an exhaustive world ranking. A federation's historical report verifies the stated reading, not necessarily its status as a current global record.
| Player and event | km/h | mph | Source and scope |
|---|---|---|---|
| Sam Groth, Busan Challenger 2012 | 263.0 | 163.4 | Guinness record entry; Challenger observation, not a claim of ATP record certification |
| John Isner, Davis Cup 2016 | 253.0 | 157.2 | Davis Cup match report; against Bernard Tomic on 6 March 2016 |
Groth's ATP 2015 media-guide biography also reports 163.4 mph. We use that source-supported figure rather than silently combining differently rounded record lists.
Selected women's high-speed serves
| Player and event | mph, source | km/h, converted | Primary evidence |
|---|---|---|---|
| Sabine Lisicki, Stanford 2014 | 131.0 | 210.8 | WTA biography, first-round serve |
| Alycia Parks, US Open 2021 | 129.0 | 207.6 | US Open report, first-round reading |
Different official WTA pages describe Lisicki's record status in different tenses. The historical 131 mph observation is clear; this page does not extrapolate it into a current, universally recognised women's record.
Selected Grand Slam serve-speed observations
| Player and event | mph, source | km/h, converted | What the source establishes |
|---|---|---|---|
| Giovanni Mpetshi Perricard, Wimbledon 2025 | 153.0 | 246.2 | ATP report, 30 June 2025: Wimbledon record at the time |
| Ben Shelton, US Open 2026 | 149.0 | 239.8 | US Open final tournament summary: fastest serve of that edition |
These are not interchangeable with season averages. A single fast serve also need not win the point: the ATP report notes that Taylor Fritz returned Mpetshi Perricard's Wimbledon record serve and won the rally.
How to measure your serve: a 40-attempt test
This is an editorial practice protocol from Stakhovsky Tennis, not a validated rating test. Use it to organise repeat measurements, not to predict a ranking or compare a child with tour professionals. Warm up appropriately, allow recovery between attempts and stop if serving is painful or your technique deteriorates.
- Record the device and settings, court, balls and conditions. Keep the measuring position consistent with the device instructions.
- After your warm-up, make 10 first-serve attempts from the deuce court and 10 from the ad court.
- Then make 10 second-serve attempts from each court. That is 20 first serves plus 20 second serves: 40 measured attempts, excluding warm-up.
- Log every attempt as in, fault or let, and record whether the device returned a usable speed. Replay lets without counting them toward the 40 attempts.
- For first and second serves separately, report the in-rate and mean speed of all successful serves with usable readings. Report the fastest successful serve separately.
- If you also calculate the average of the five fastest successful serves, label it exactly that. With fewer than five usable successful serves, leave that statistic unreported.
Do not discard slow successful serves from the ordinary mean. Missing device readings need their own count; they are not zero-speed serves. Unpaired second-serve faults in this drill are not match double faults. A repeat test is comparable only when its method and conditions are reasonably consistent.
Bring match footage as well as test readings. The remote match review can help connect a serve pattern to decisions under score pressure; the match-length evidence guide explains why a short speed test does not measure match endurance.
Can you improve serve speed without losing control?
Start with the actual constraint: contact, rhythm, placement, repeatability or the first shot after the serve. A useful practice goal keeps accuracy visible. A faster maximum with a lower in-rate is not automatically better match performance.
There is no supported universal promise that a player will gain a fixed number of mph within a few weeks. Equipment changes and training plans need individual assessment, and a public reference table cannot diagnose pain or prescribe rehabilitation.
A limited first-party example: the published Cinar Prague Performance Block case study reports serve speed changing from 131 to 150 km/h. That is a 19 km/h difference, not a typical client result. The case does not disclose block duration, measurement devices or test conditions.
A 90-minute performance assessment in Prague costs 3,800 CZK (≈ €155), with court fees extra. The assessment fee is credited toward the first programme period if the player continues. Check the current scope and pricing; subsequent training is quoted separately and no speed gain is guaranteed.
Method, attribution and limitations
Stakhovsky Tennis compiled this reference from linked source publications and official event reports, checked on 11 October 2026. Publication in 2026 does not make historical measurements current. Source labels, observation periods and measurement classes remain separate in the downloads.
- Recreational ranges are attributed coaching estimates without a disclosed sample.
- Cross's historical means, Parpa's youth court test and ATP season averages are different measures.
- The record tables are deliberately selective. They do not certify global completeness or a shared calibration standard.
- Converted values use 1 mph = 1.609344 km/h and one-decimal rounding. The youth rows retain the original two-decimal km/h values.
- This is an editorial compilation, not original player measurement research.
Original Stakhovsky Tennis compilation, chart design and annotations are licensed under CC BY 4.0. Third-party material remains subject to its source terms. No cited organisation is presented as endorsing this page.
Download the serve-speed data and chart
The source extract contains 27 speed observations or ranges. Each row preserves its source unit, period, evidence class and comparison limit. The CSV begins with column headers; the JSON also carries attribution and licence metadata.
Frequently asked questions
What is the average tennis serve speed?
No single average covers all players. Cross's historical 2008–2009 Grand Slam study reported first-serve means of 184.1 km/h for men and 158.5 km/h for women. These are not current tour-wide averages or recreational targets.
What is the average serve speed for a 3.5 tennis player?
This compilation does not establish a verified national average for NTRP 3.5. A rating is not a speed category, and app statistics need a defined population and measurement method before comparison with radar readings.
What is a good serve speed for a club player?
PlayYourCourt's July 2026 table gives 80–100 mph for its solid-club-player category. That is a coaching estimate without a disclosed sample, not an official standard. Judge speed alongside accuracy, placement and results.
What is the fastest tennis serve on record?
Guinness lists Sam Groth's Busan Challenger serve on 9 May 2012 at 263 km/h (163.4 mph). This source-specific record should not be confused with an ATP-certified, universally comparable ranking of every recorded serve.
What is the fastest women's serve?
The verified examples here include Sabine Lisicki's 131 mph serve at Stanford in 2014 and Alycia Parks's 129 mph serve at the 2021 US Open. This selected list does not establish a current universal women's record.
Who had the fastest average ATP serve in 2025?
Giovanni Mpetshi Perricard led the ATP Tour's published 2025 tables at 134.4 mph for first serves and 117 mph for second serves. The ATP published those season figures on 18 January 2026.
How much slower is a second serve?
In Cross's historical sample, subtracting the means gives 33.7 km/h for men and 25.1 km/h for women. Individual differences vary. These calculations are not a prescription for how much a player should slow down.
Does height affect serve speed?
Parpa and colleagues found an association between height and serve velocity in their 16-boy sample (r = 0.60). That small observational result does not establish causation or a speed ceiling for a shorter player.
How fast should a junior tennis player serve?
There is no universal pass mark in this review. A study of 27 youth players reported mean court-test speeds of 174.69 km/h for boys and 146.45 km/h for girls, with mean ages close to 16. These are sample findings, not age-specific targets.
How quickly can I increase my serve speed?
No fixed gain or deadline is guaranteed. Record a consistent baseline, accuracy and match performance, then review an individual plan. The 40-attempt protocol on this page is a repeat-measurement tool, not a promise of improvement.
Sources and how to cite this compilation
For a number, cite its original source and observation period. When reusing this page's selection, conversions or chart, also credit the Stakhovsky Tennis compilation.
- PlayYourCourt recreational serve guidance, 23 July 2026
- Cross, Men's tennis vs Women's tennis, ITF review, 2014
- ATP Tour: 2025 average serve-speed leaders, published 18 January 2026
- Parpa et al., youth physical performance and stroke velocity, Sports 11(1), 7
- Guinness: Groth's 2012 serve record and ATP 2015 biography
- Davis Cup: Isner versus Tomic, 6 March 2016
- WTA: Lisicki biography and 2014 serve observation
- US Open: Parks's 2021 serve reading
- ATP: Mpetshi Perricard at Wimbledon, 30 June 2025
- US Open: final 2026 tournament numbers